
Directions— Study the following graph carefully to answer the questions that follow—
Quantity of Various Items Sold and Price Per kg
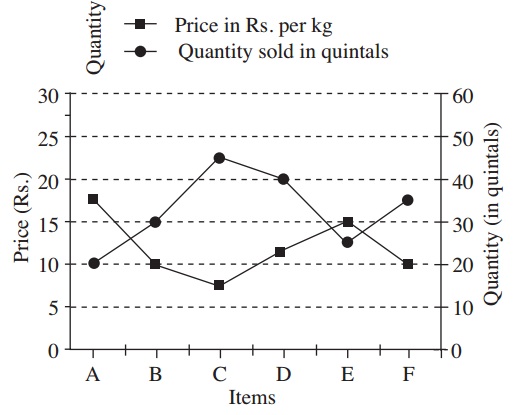
1. If the quantity sold of item D increased by 50% and the price reduced by 10%. What was the total value of the quantity sold for item D ?
a) Rs. 675
b) Rs. 6‚750
c) Rs. 67‚550
d) Rs. 67‚500
e) None of these
2. Approximately, what is the average price per kg of items A, B and C ?
a) Rs. 9·50
b) Rs. 8
c) Rs. 7·50
d) Rs. 9
e) Rs. 10·50
3. What is the ratio between the total values of quantity sold for items E and F respectively ?
a) 15 : 14
b) 3 : 2
c) 5 : 7
d) 7 : 5
e) None of these
4. Total value of the quantity sold for item C is what per cent of the total value of the quantity sold for item E ?
a) 111
b) 85
c) 90
d) 87·5
e) None of these
5. If the price as well as the quantity sold is increased by 20% for item A, what is the total value of quantity sold for item A ?
a) Rs. 48‚500
b) Rs. 49‚000
c) Rs. 42‚000
d) Rs. 50‚400
e) None of these
Directions (6-10): Following pie-chart shows the percentage distribution of monthly budget of a family and the line graph shows the monthly expenditure (in Rs. thousands) of a family to fulfill this budget from January to June.
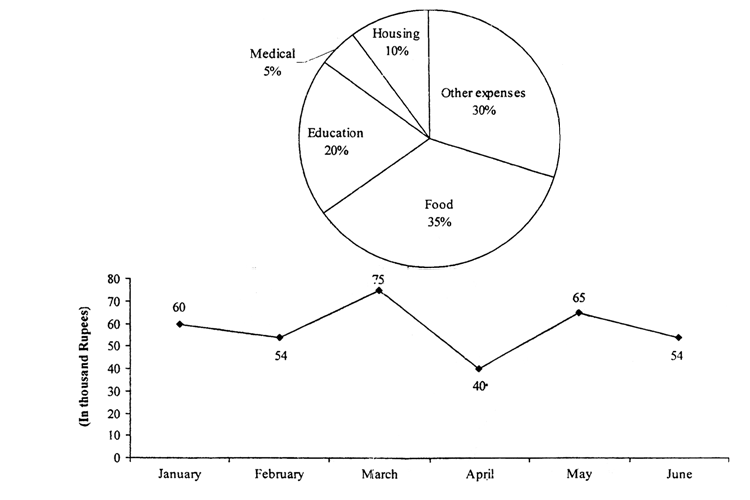
6. How much money they spent on food in April?
a) 11 thousand
b) 12 thousand
c) 13 thousand
d) Can’t say
e) None of these
7. What is the difference between the money they spent on education in the month of March and money they spend on housing in April?
a) 11 thousand
b) 12 thousand
c) 13 thousand
d) 14 thousand
e) None of these
8. What is the percentage rise in the money spent on other expenses from January to March?
a) 5%
b) 10%
c) 15%
d) 20%
e) 25%
9. What is the average expenditure on housing for all six months?
a) 4 thousand
b) 4.8 thousand
c) 5 thousand
d) 5.8 thousand
e) None of these
10. What is the ratio of amount spent on medical in January to the amount spent on education in the month of March?
a) 1 : 3
b) 3 : 1
c) 1 : 5
d) 3 : 5
e) None of these