Quantitative Aptitude Quiz for IBPS | SBI – Set 201

DIRECTIONS (1-5) :Study the information given and answer the following questions.

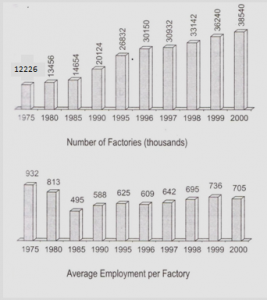
1)Between 1995 and 2000, in which year has the average employment per factory shown an increment compared to previous year, but decreased in the next year?
1) 1996
2) 1997
3) 1998
4) 1999
5) None of these

Click to View Answer
Answer 4) 1999
in 1999, average employment per factory is greater than 1998 and less than 2000.

2)If in 1996, 20,100 factories had 659 employments on an average, the remaining factories had an average employment of?
1) 559
2) 509
3) 584
4) 534
5) None of these

Click to View Answer
Answer 2)509
in 1996, for 20100 factories , employees = 13,245,900; average = 609, total employees = 18,361,350. So average for remaining factories = 509.

3)The total employment in 1999 is how many times to that in 1996?
1) 1.45
2) 1.48
3) 1.6
4) 1.42
5) None of these

Click to View Answer
Answer 1)1.45
total employment in 1999= 36240 x 736.
Total employment in 1996 = 609 x 30150,
Ratio = (36240×736)/(30150×609)=1.45

4)In which of the following five-year period, number of factories has shown maximum increase?
1) 1980-85
2) 1985-90
3) 1990-95
4) 1995-00
5) None of these

Click to View Answer
Answer 4)1995-00
From the figure it can be seen that the maximum increase in the number of factories is in 1995- 2000.

5)Among the given period, in how many years has the trend of the average employment per factory not changed with respect to the previous year’s change?
1) Two
2) Three
3) Four
4) Can’t be determined
5) None of these

Click to View Answer
Answer 4)Can’t be determined
we do not have year wise data in between 1975- 1980 & similarly between 1980-1985,etc.

Directions (6 – 10): Study the following line graph and answer the questions based on it.

Number of Vehicles Manufactured by Two companies over the Years (Number in Thousands)

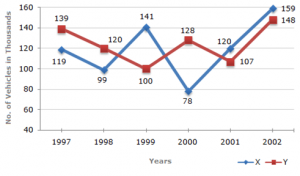
6)What is the difference between the number of vehicles manufactured by Company Y in 2000 and 2001?
1) 50, 000
2) 42, 000
3) 33, 000
4) 21, 000
5) None of these

Click to View Answer
Answer 4)21,000
Required difference = (128000 – 107000) = 21000.

7)What is the difference between the total productions of the two Companies in the given years ?
(1) 19, 000
(2) 22, 000
(3) 26, 000
(4) 28, 000
(5) None of these

Click to View Answer
Answer 3)26,000
From the line-graph it is clear that the productions of Company X in the years 1997, 1998, 1999, 2000, 2001 and 2002 are 119000, 99000, 141000, 78000, 120000 and 159000 and those of Company Y are 139000, 120000,100000, 128000, 107000 and 148000 respectively.
Total production of Company X from 1997 to 2002
= 119000 + 99000 + 141000 + 78000 + 120000 + 159000 = 716000.
and total production of Company Y from 1997 to 2002
= 139000 + 120000 + 100000 + 128000 + 107000 + 148000
= 742000.
Difference = (742000 – 716000) = 26000.

8)What is the average numbers of vehicles manufactured by Company X over the given period? (Rounded off to nearest integer)
1) 1, 19, 333
2) 1, 13, 666
3) 1, 12, 778
4) 1, 11, 223
5) None of these

Click to View Answer
Answer 1)1, 19, 333
Average number of vehicles manufactured by Company X =1/6 *(119000 + 99000 + 141000 + 78000 + 120000 + 159000 =119333.

9)In which of the following years, the difference between the productions of Companies X and Y was the maximum among the given years?
1) 1997
2) 1998
3) 1999
4) 2000
5) None of these

Click to View Answer
Answer 4)2000
The difference between the productions of Companies X and Y in various years is:
For 1997 (139000 – 119000) = 20000.
For 1998 (120000 – 99000) = 21000.
For 1999 (141000 – 100000) = 41000.
For 2000 (128000 – 78000) = 50000.
For 2001 (120000 – 107000) = 13000.
For 2002 (159000 – 148000) = 11000.
Clearly, maximum difference was in 2000

10)The production of Company Y in 2000 was approximately what percent of the production of Company X in the same year?
1) 173
2) 164
3) 132
4) 97
5) None of these

Click to View Answer
Answer 2)164
Required percentage = [(128000/ 78000) x 100]% » 164%

Check out our latest videos on youtube