
Needless to say how much important part is the D.I section in Banking Exams. It can provides you whole marks if attempts good so Abreast yourself with new techniques and practice more.
CHECK YOUR TIME HERE:
Direction: Study the given pie-charts carefully to answer the questions that follow
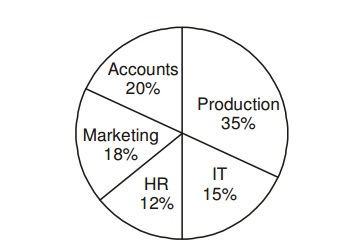
Breakup of number of employees working in different departments of an organisation, the, number of males and the number of employees who recently got promoted in each department break-up of employees working in different departments total number of employees = 3,600 Employees working in different departments:
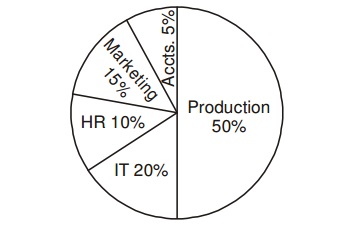
Break-up of number of males in each department Total number of males in the organisation = 2,040 Break-up of number of males working in each department
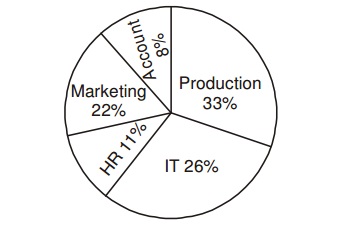
Break-up of number of employees who recently got promoted in each department Total number of employees who got promoted = 1,200 Number of employees who recently got promoted from each department
1. If half of the number of employees who got promoted from the IT department were males, what was the approximate percentage of males who got promoted from the IT department ?
(1) 61
(2) 29
(3) 54
(4) 42
(5) 38
2. What is the total number of females working in the Production and Marketing departments together ?
(1) 468
(2) 812
(3) 582
(4) 972
(5) None of these
3. How many females work in the Accounts department ?
(1) 618
(2) 592
(3) 566
(4) 624
(5) None of these
4. The total number of employees who got promoted from all the departments together was what percent of the total number of employees working in all the departments together ? (Rounded off to the nearest integer)
(1) 56
(2) 21
(3) 45
(4) 33
(5) 51
5. The number of employees who got promoted from the HR department was what percent of the total number of employees working in that department ? (rounded off to two digits after decimal)
(1) 36.18
(2) 30.56
(3) 47.22
(4) 28.16
(5) None of these
Direction: Study the given pie-charts carefully to answer the questions that follow
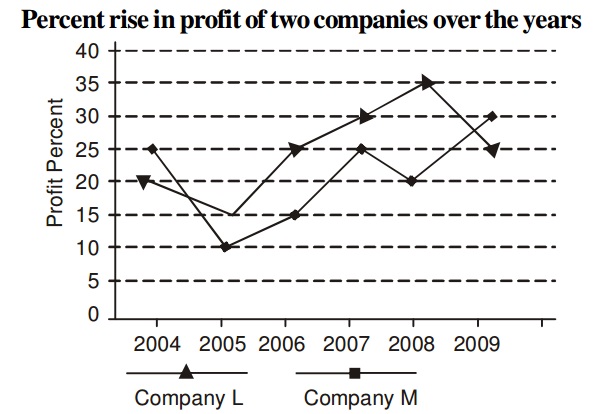
6. If the profit earned by Company L in the year 2005 was Rs. 1.84 lakhs, what was the profit earned by the company in the year 2006 ?
(1) Rs. 2.12 lakhs
(2) Rs. 2.3 lakhs
(3) Rs. 2.04 lakhs
(4) Cannot be determined
(5) None of these
7. If the profit earned by Company M in the year 2008 was Rs. 3.63 lakhs, what was he amount of profit earned by it in the year 2006 ?
(1) Rs. 2.16 lakhs
(2) Rs.1.98 lakhs
(3) Rs. 2.42 lakhs
(4) Cannot be determined
(5) None of these
8. What is the average percent rise in profit of Company L over all the years together ?
(1) 15 (1/3)
(2) 25 (1/3)
(3) 18 (5/6)
(4) 21 (5/6)
(5) None of these
9. Which of the following statements is TRUE with respect to the above graph ?
(1) Company M made the highest profit in the year 2009
(2) Company L made least profit in the year 2005
(3) The respective ratio between the profits earned by Company L and M In the year 2006 was 6:5
(4) Company L made the highest profit in the year 2008
(5) All are true
10. What is the percentage increase in percent rise in profit of Company M in the year 2009 from the previous year ?
(1) 25
(2) 15
(3) 50
(4) 75
(5) None of these
Answers (5), (3), (1), (4), (2), (2), (3), (5), (1), (4)