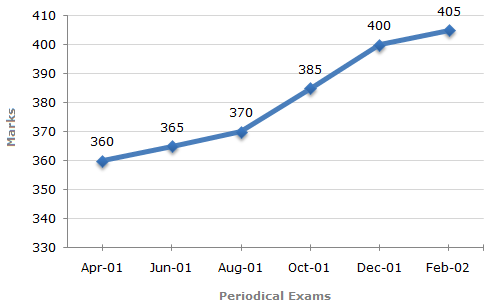
In a school the periodical examination are held every second month. In a session during April 2001 – March 2002, a student of Class IX appeared for each of the periodical exams. The aggregate marks obtained by him in each periodical exam are represented in the line-graph given below.
Marks Obtained by student in Six Periodical Held in Every Two Months During the Year in the Session 2001 – 2002.
Maximum Total Marks in each Periodical Exam = 500
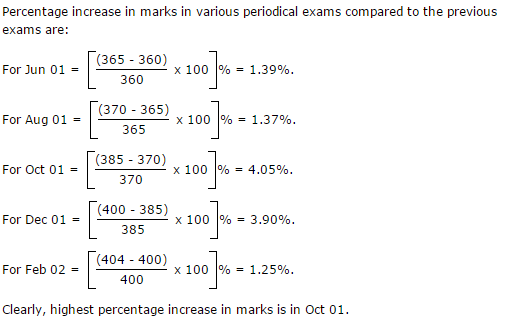
1) In which periodical exams did the student obtain the highest percentage increase in marks over the previous periodical exams ?
a) June, 01
b) August, 01
c) Oct, 01
d) Dec, 01
2) The total number of marks obtained in Feb. 02 is what percent of the total marks obtained in April 01 ?
a) 110%
b) 112.5%
c) 115%
d) 116.5%
3) What is the percentage of marks obtained by the student in the periodical exams of August, 01 and Oct, 01 taken together ?
a) 73.25%
b) 75.5%
c) 77%
d) 78.75%
4) What are the average marks obtained by the student in all the periodical exams during the last session ?
a) 373
b) 379
c) 381
d) 385
5) In which periodical exams there is a fall in percentage of marks as compared to the previous periodical exams ?
a) None
b) June, 01
c) Oct, 01
d) Feb, 02
The following table gives the percentage distribution of population of five states, P, Q, R, S and T on the basis of poverty line and also on the basis of sex.
| State | Percentage of Population below the Poverty Line | Proportion of Males and Females | |
| Below Poverty Line | Above Poverty Line | ||
| M : F | M : F | ||
| P | 35 | 5 : 6 | 6 : 7 |
| Q | 25 | 3 : 5 | 4 : 5 |
| R | 24 | 1 : 2 | 2 : 3 |
| S | 19 | 3 : 2 | 4 : 3 |
| T | 15 | 5 : 3 | 3 : 2 |
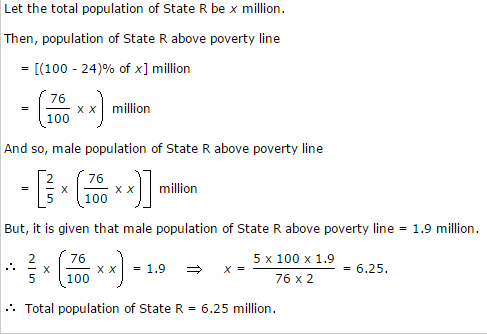
6) If the male population above poverty line for State R is 1.9 million, then the total population of State R is?
a) 4.5 million
b) 4.85 million
c) 5.35 million
d) 6.25 million
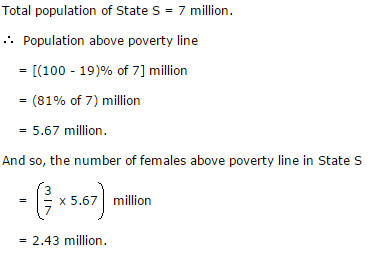
7) What will be the number of females above the poverty line in the State S if it is known that the population of State S is 7 million?
a) 3 million
b) 2.43 million
c) 1.33 million
d) 5.7 million
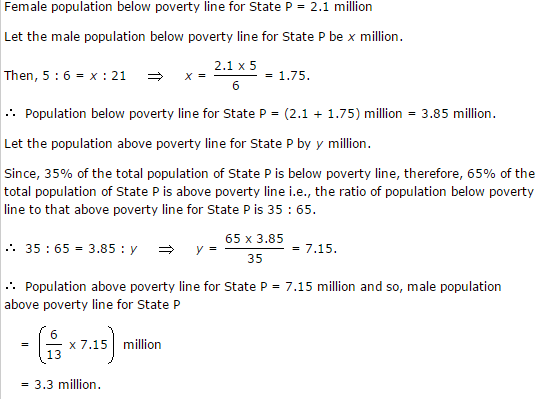
8) What will be the male population above poverty line for State P if the female population below poverty line for State P is 2.1 million?
a) 2.1 million
b) 2.3 million
c) 2.7 million
d) 3.3 million
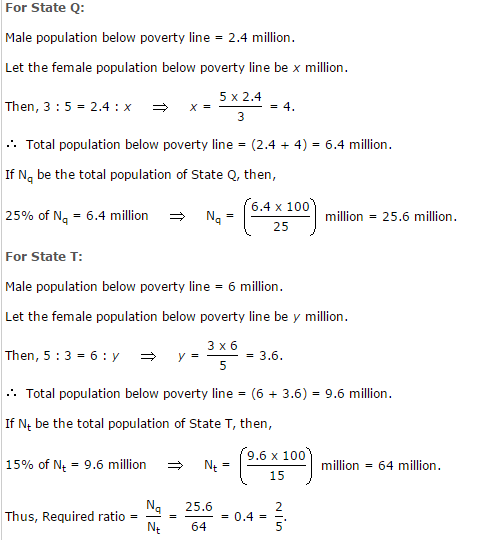
9) If the population of males below poverty line for State Q is 2.4 million and that for State T is 6 million, then the total populations of States Q and T are in the ratio?
a) 1:3
b) 2:5
c) 3:7
d) 4:9