As you know Quantitative Aptitude is important for getting a good score in any exam, we are sharing with you a practice Set of Quant to help you prepare better for the forthcoming exam. The Topic is Data Interpretation.
Directions—Study the following graph carefully and answer the questions that follow—
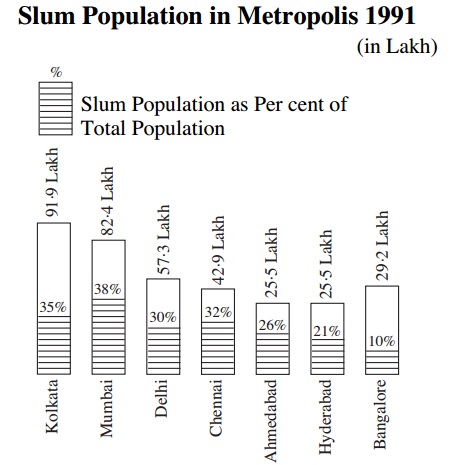
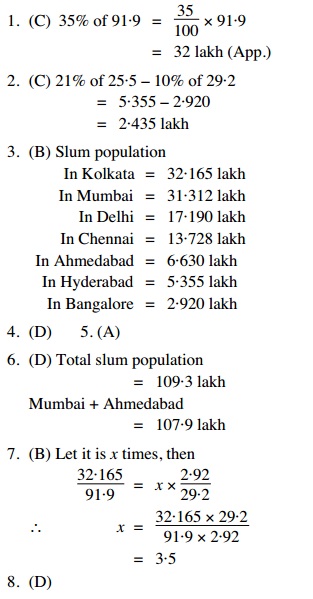
1. The total slum population of Kolkata in 1991 was approximately—
(A) 30 lakh
(B) 31 lakh
(C) 32 lakh
(D) 33 lakh
(E) None of these
2. The difference in the slum population of Bangalore and Hyderabad was—
(A) 4·1 lakh
(B) 3·71 lakh
(C) 2·43 lakh
(D) 2 lakh
(E) None of these
3. The city with the highest slum population was—
(A) Mumbai
(B) Kolkata
(C) Delhi
(D) Chennai
(E) None of these
4. Two cities with nearly equal slum population were—
(A) Ahmedabad and Hyderabad
(B) Delhi and Chennai
(C) Hyderabad and Bangalore
(D) Mumbai and Kolkata
(E) None of these
5. The slum population of Delhi was more than 3 times the slum population of—
(A) Hyderabad
(B) Ahmedabad
(C) Bangalore
(D) Chennai
(E) None of these
6. The slum population of all the seven cities nearly equalled the total population of—
(A) Kolkata and Bangalore
(B) Delhi and Chennai
(C) Delhi and Hyderabad
(D) Mumbai and Ahmedabad
(E) None of these
7. The ratio of slum population to total population in Kolkata was what times the same ratio in Bangalore ?
(A) 3
(B) 3·5
(C) 4
(D) 5
(E) None of these
8. In terms of slum population, the second city with the least population was—
(A) Delhi
(B) Bangalore
(C) Ahmedabad
(D) Hyderabad
(E) None of these
ANSWERS AND EXPLANATIONS