
Study the following bar chart and answer the questions carefully.
Sales Turnover of 5 Companies (in Rs. crores)
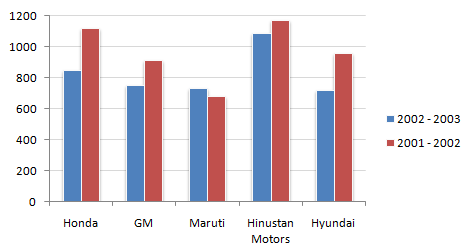
1) What is the percentage change in the overall sales turnover of the five companies together between 2001 – 2002 and 2002 – 2003 ?
a) 17.21 %
b) 14.68 %
c) 12.67 %
d) 21.24 %
2) What is the absolute change in overall sales turnover of the five companies together between 2001 – 2002 and 2002 – 2003 ?
a) 712.43
b) 142.48
c) 683.53
d) None of these
3) Which of the companies shows the maximum percentage difference in sales turnover between the two years ?
a) Honda
b) GM
c) Hyundai
d) Maruti
4) What should have been the sales turnover of GM in 2002 – 2003 to have shown an excess of the same quantum over 2001 – 2002 as shown by the sales turnover of Maruti ?
a) 953.76
b) 963.76
c) 952.76
d) 962.76
5) What is the approximate difference between the average sales turnover of all the companies put together between the years 2001 – 2002 and 2002 – 2003 ?
a) 133.45
b) 142.48
c) 117.6
d) None of these
The following bar chart shows the trends of foreign direct investments(FDI) into India from all over the world.
Trends of FDI in India
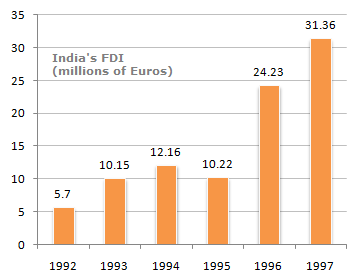
1) What was the ratio of investment in 1997 over the investment in 1992 ?
a) 5.50
b) 5.36
c) 5.64
d) 5.75
2) What was absolute difference in the FDI to India in between 1996 and 1997 ?
a) 7.29
b) 7.13
c) 8.13
d) None of these
3) If India FDI from OPEC countries was proportionately the same in 1992 and 1997 as the total FDI from all over the world and if the FDI in 1992 from the OPEC countries was Euro 2 million. What was the amount of FDI from the OPEC countries in 1997 ?
a) 11
b) 10.72
c) 11.28
d) 11.5
4) Which year exhibited the highest growth in FDI in India over the period shown ?
a) 1993
b) 1994
c) 1995
d) 1996
5) What was India’s total FDI for the period shown in the figure ?
a) 93.82
b) 93.22
c) 93.19
d) None of these