
(qus 1-5)The following table shows the number of new employees added to different categories of employees in a company and also the number of employees from these categories who left the company every year since the foundation of the Company in 1995.
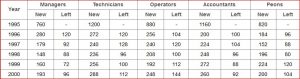
1)What is the difference between the total number of Technicians added to the Company and the total number of Accountants added to the Company during the years 1996 to 2000?
A)128
B)112
C)96
D)88
2)What was the total number of Peons working in the Company in the year 1999?
A)1312
B)1192
C)1088
D)968
3)For which of the following categories the percentage increase in the number of employees working in the Company from 1995 to 2000 was the maximum?
A)Managers
B)Technicians
C)Operators
D)Accountants
4) What is the pooled average of the total number of employees of all categories in the year 1997?
A)1325
B)1195
C)1265
D)1235
5)During the period between 1995 and 2000, the total number of Operators who left the Company is what percent of total number of Operators who joined the Company?
A)19%
B)21%
C)27%
D)29%
(qus 6-10)Production of paper (in lakh tonnes) by three companies X, Y and Z over the years. Study the graph and answer the questions that follow.
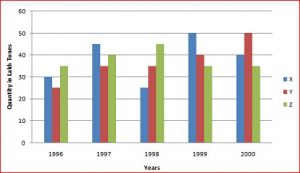
6)What is the difference between the production of company Z in 1998 and company Y in 1996?
A)2,00,000 tons
B)20,00,000 tons
C)20,000 tons
D)2,00,00,000 tons.
E)None of these
7)What is the ratio of the average production of company X in the period 1998-2000 to the average production of company Y in the same period?
A)1:1
B)15:17
C)23:25
D)27:29
E)None of these.
8)What is the percentage increase in the production of company Y from 1996 to 1999?
A)30%
B)45%
C)50%
D)60%
E)75%
9)The average production for five years was maximum for which company?
A)X
B)Y
C)Z
D)X and Y both
E)X and z both
10)In which year was the percentage of production of company Z to the production of company Y the maximum?
A)1996
B)1997
C)1998
D)1999
E)2000